Avidbank Holdings (AVBH)·Q4 2025 Earnings Summary
Avidbank Holdings Posts Strong Q4 as NIM Expands 64 bps; NPAs Rise on Construction Loans
January 30, 2026 · by Fintool AI Agent
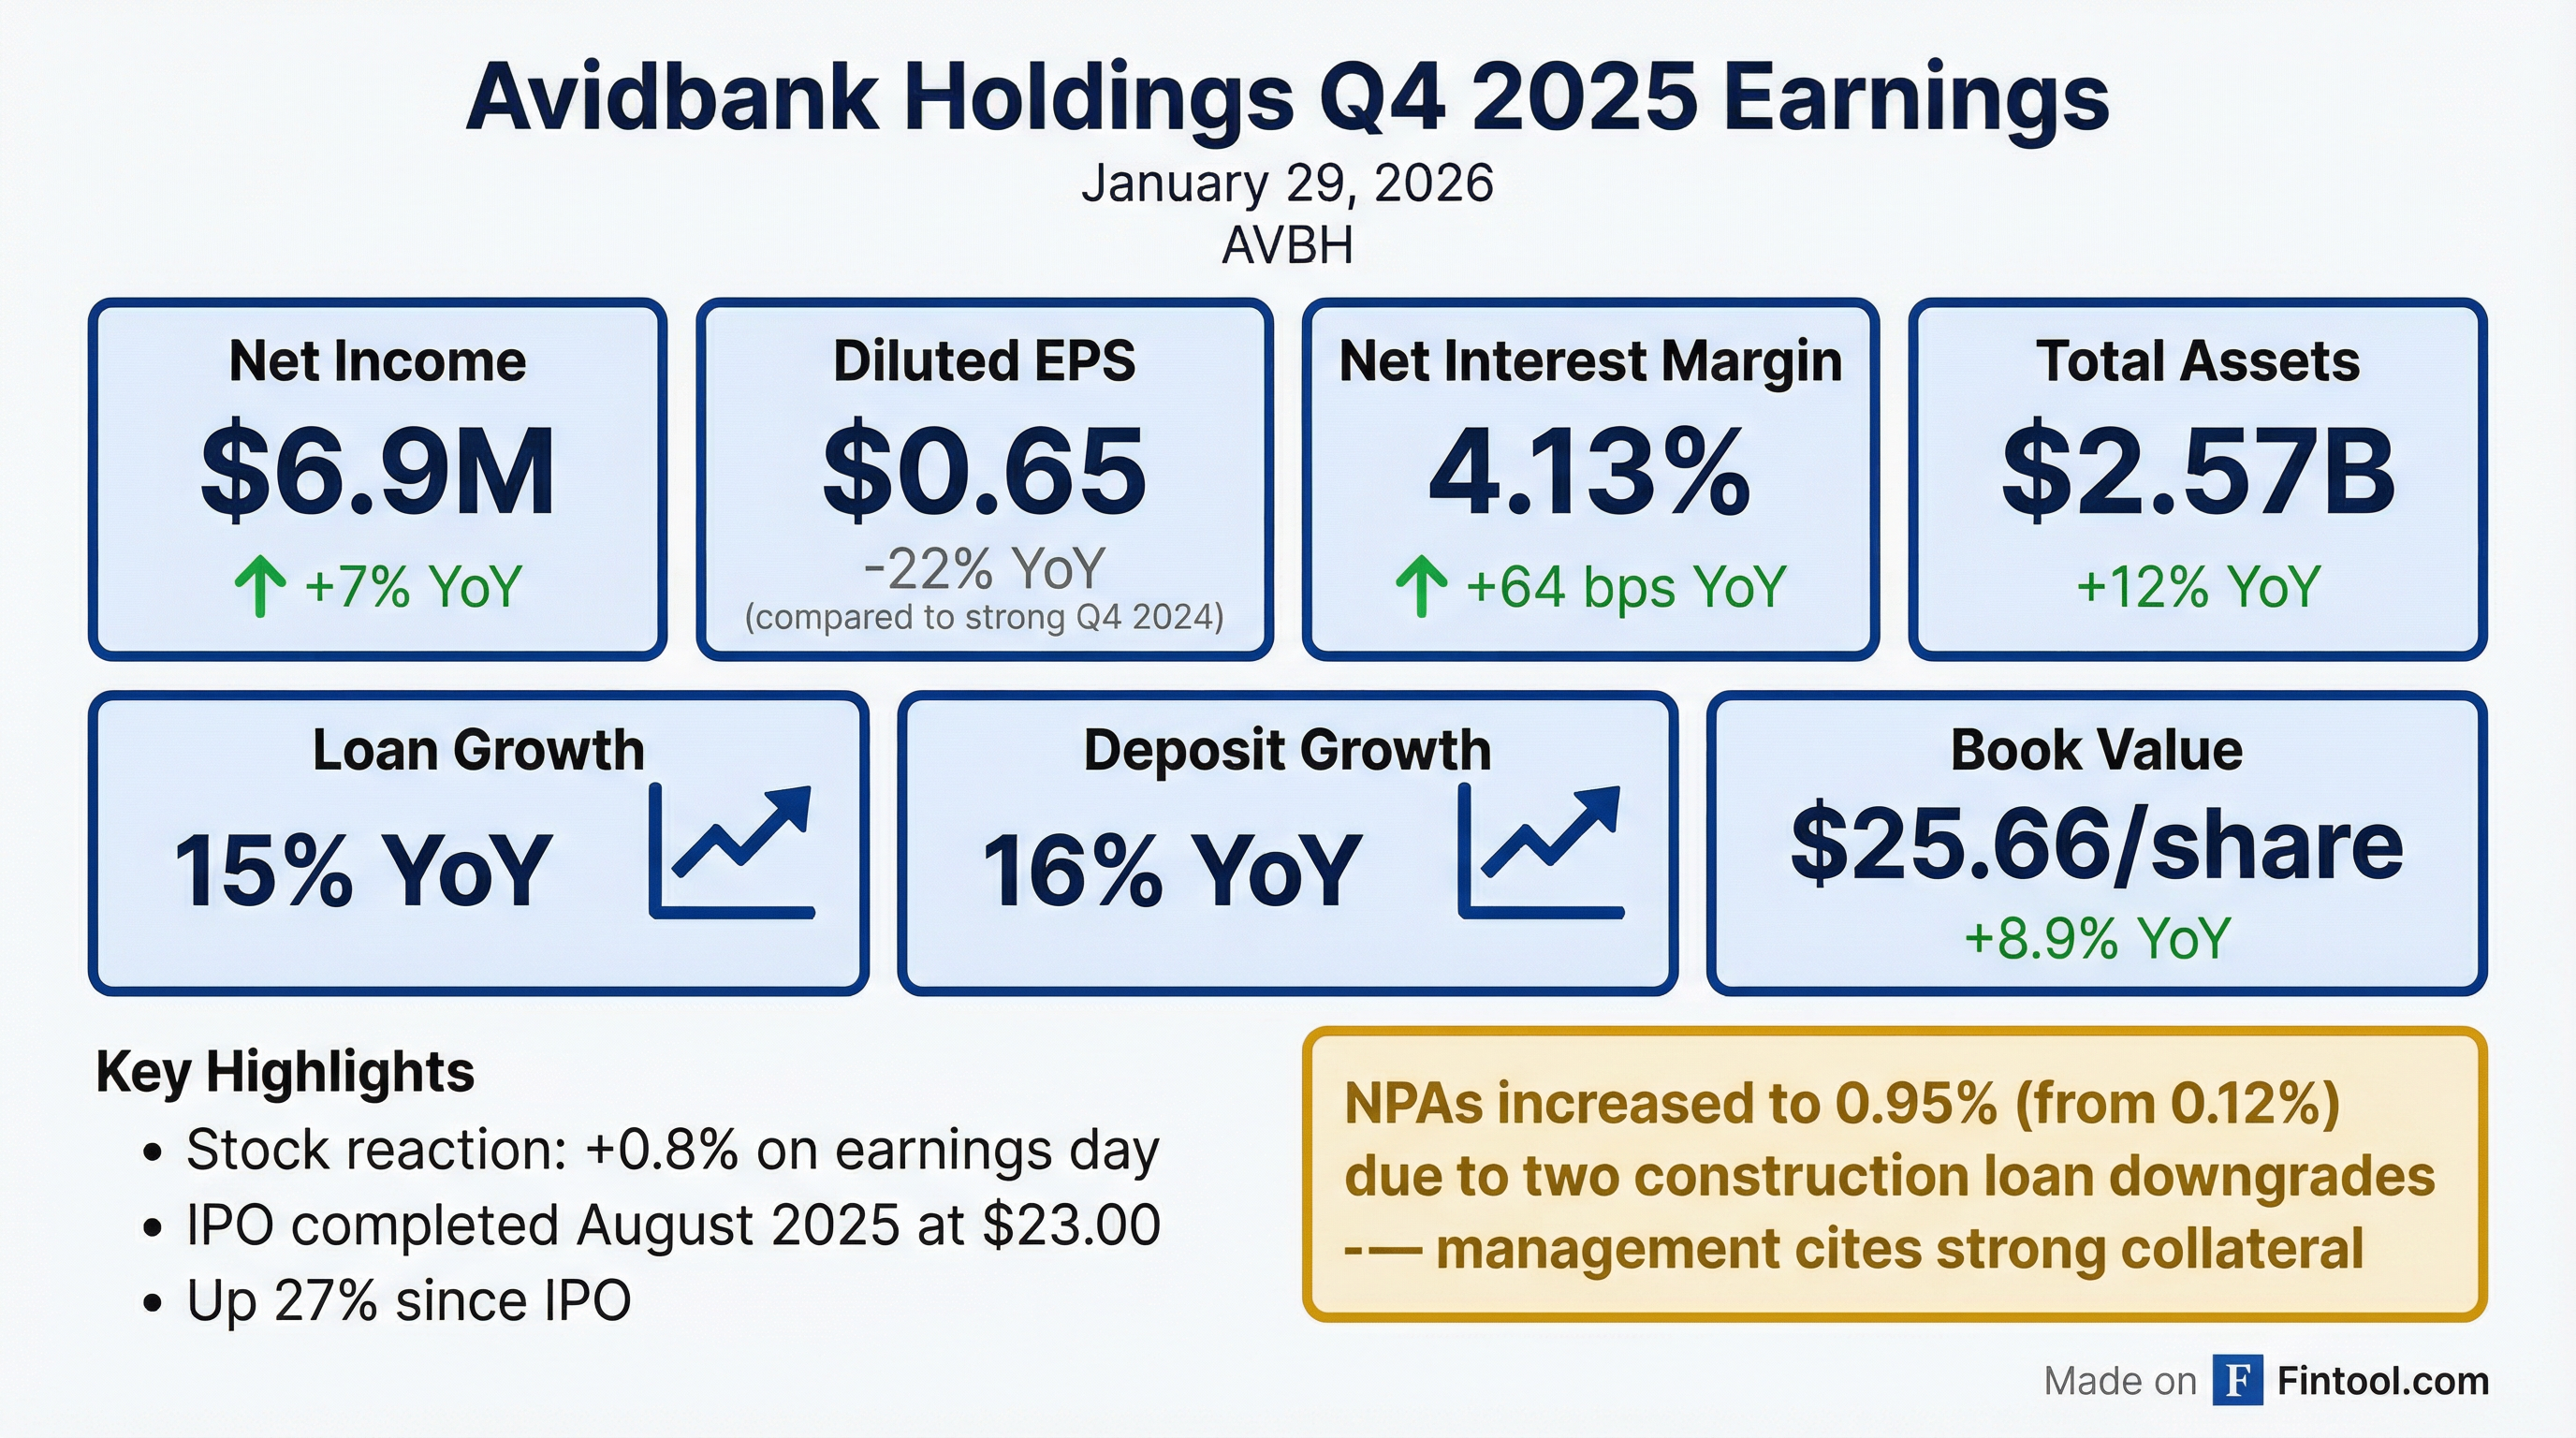
Avidbank Holdings (NASDAQ: AVBH) reported a strong fourth quarter with net income of $6.9 million, or $0.65 per diluted share, marking a return to normalized profitability after Q3's one-time securities repositioning loss. The Bay Area-focused commercial bank delivered 64 basis points of net interest margin expansion year-over-year to 4.13%, though elevated non-performing assets from construction loan downgrades tempered an otherwise solid quarter.
Did Avidbank Beat Earnings?
Avidbank reported Q4 2025 diluted EPS of $0.65, compared to $0.84 in Q4 2024. The year-over-year decline reflects higher share count following the company's August 2025 IPO, which added 3.0 million shares to the float. On an adjusted basis excluding the prior quarter's $62.4 million securities loss, the bank generated full-year adjusted EPS of $2.80, up from $2.76 in 2024.
Note: As a recently IPO'd small-cap bank, AVBH has limited analyst coverage, making traditional beat/miss comparisons less meaningful.
How Did the Stock React?
AVBH shares rose 0.8% on earnings day to $27.59, extending the stock's strong run since its August 2025 IPO at $23.00 per share. The stock is now up 27% since going public and trading near its 52-week high of $27.99.
The muted positive reaction reflects the market balancing strong operating metrics against the elevated non-performing asset ratio. Book value per share increased to $25.66, providing downside support at current levels.
What Drove the Strong Net Interest Margin?
Net interest margin expanded to 4.13% in Q4, up 23 basis points sequentially and 64 basis points year-over-year. The improvement stemmed from:
Securities Portfolio Repositioning: In Q3 2025, management made the strategic decision to sell $274.7 million in low-yielding available-for-sale securities at a $62.4 million loss, reinvesting proceeds in securities yielding 4.57% on average. This drove the yield on securities to 4.61% in Q4, up from 2.29% a year ago.
Lower Funding Costs: The cost of interest-bearing deposits fell 61 basis points year-over-year to 3.18%, while overall deposit costs declined to 2.39%. Average non-interest-bearing demand deposits increased $103.8 million compared to Q4 2024.
Loan Yield Normalization: While loan yields declined 40 basis points to 6.68% due to Fed rate cuts, the improvement in deposit and securities yields more than offset this drag.
What Happened With Asset Quality?
Non-performing assets jumped to 0.95% of total assets from 0.12% in the prior quarter—the primary concern in an otherwise strong quarter. The deterioration stemmed from:
- Two construction loans totaling $19.4 million moved to non-accrual
- One commercial loan of $5.1 million added to non-performing
CEO Mark Mordell provided specific detail on the call: "The good news is that we're well collateralized in those two construction loans, and one is already taking care of itself—it's already been paid off, and that was about a $3.7 million construction loan."
On the larger loan, he explained: "The other loan is a $16 million construction loan, a multi-unit, mixed-use in Palo Alto, and that's been a hangover from COVID, a lot of delays. We feel we're well collateralized there as well. We have houses and guarantees... It's gonna be on our books for, you know, anywhere from 4-6 months."
Importantly, criticized and classified loans remain stable at $37 million and $38 million respectively, suggesting no broader credit migration trend.
The provision for credit losses increased to $2.8 million from $1.4 million in Q3, reflecting higher loan balances and a $1.2 million specific reserve on the downgraded commercial loan. Total allowance for credit losses stood at $22.3 million, or 1.04% of total loans.
What Did Management Guide?
Loan and Deposit Growth: Management is targeting 10-15% growth in both loans and deposits for 2026, maintaining their identity as a "growth bank." CEO Mordell noted: "We need to be that growth bank... I think we always are targeting 10%-15% type of asset growth every year. So that's what we're targeting this year and feel that it's very accomplishable."
Net Interest Margin: CFO Pat Oakes indicated NIM could stay around 4.25% after normalizing for the one-time interest reversal. However, he flagged headwinds including: (1) new deposits may come in at higher rates than the existing portfolio, and (2) $254 million of loans at floors will reset as they renew, with ~60% maturing in 2026.
Expenses: The run rate is expected to rise to $14 million+ per quarter in 2026, up from $13.9 million in Q4, driven by higher taxes, insurance costs, and ongoing operational growth.
Tax Rate: Expected to normalize to ~28.5% in 2026, down from the elevated 31.1% in Q4 which was impacted by California tax law changes.
Sub-Debt Refinancing: Management is working on investment-grade ratings and plans to address the subordinated debt in 2026 before another 20% burns off.
What Changed From Last Quarter?
The securities repositioning is now behind them. Q3 2025's results were dominated by the $62.4 million loss on securities sales—a strategic move that unlocked significant future earnings power. Q4 demonstrates what Avidbank looks like post-restructuring: a high-NIM, growth-oriented commercial bank.
Balance sheet momentum accelerated. Loans grew $189.9 million (38% annualized) in Q4, driven by $178 million in commercial and industrial loans. Deposits grew $136.9 million (27% annualized), with strong growth in both non-interest-bearing and money market accounts.
Capital position remains strong. Total risk-based capital ratio of 12.6% and Tier 1 leverage ratio of 11.2% provide ample room for continued growth. The August 2025 IPO raised $61.3 million net, funding both the securities repositioning and loan growth. Capital ratios have improved steadily, with Common Equity Ratio rising from 6.3% in 2021 to 10.9% in 2025.
Balance Sheet Growth
How Is the Loan Portfolio Positioned?
Avidbank operates a diversified lending platform across five verticals, with a commercial focus—C&I plus owner-occupied CRE account for 57% of total loans. The portfolio is increasingly national, with 26% of loan balances now outside California.
Interest Rate Composition: 52% floating, 25% adjustable, 23% fixed—providing significant asset sensitivity to rate movements.
Non-Owner Occupied CRE Detail: The $424 million CRE book is diversified across office (7% of loans), retail (4%), hotel/motel (4%), industrial (3%), and warehouse (1%).
How Do Deposits Fund the Business?
Avidbank's deposit strategy links lending verticals with standalone initiatives. The Venture Lending & Fund Finance division is a deposit powerhouse, generating deposits well in excess of loan balances.
This self-funding model is a key differentiator—the relationship-heavy verticals subsidize the asset-focused real estate businesses.
What's the Interest Rate Sensitivity?
Management disclosed updated interest rate sensitivity showing the bank is moderately asset-sensitive:
The asymmetric profile (more upside from rate hikes than downside from cuts) reflects the floating-rate loan book and ongoing deposit cost optimization.
How Has Credit Quality Evolved Historically?
While Q4's NPA spike is notable, Avidbank's long-term credit track record is strong. Net charge-offs have averaged just 6 basis points annually since 2017, demonstrating disciplined underwriting through multiple cycles.
The credit process includes multi-level approval, regular portfolio reviews, twice-monthly Special Asset Committee meetings, and independent third-party reviews covering over 90% of loan balances.
What Did Management Say?
CEO Mark Mordell struck an optimistic tone: "We closed 2025 with a strong quarter as well as significant momentum and a clear trajectory for 2026. Our fourth quarter performance was driven by all five of our verticals in both loans and deposits. We achieved this through the dedication and resilience of our bankers and employees."
The five verticals referenced are Avidbank's core business lines: commercial & industrial lending, venture lending, structured finance, asset-based lending, and real estate (construction and CRE).
What's the Investment Case?
Bull Case:
- NIM expansion has runway—securities portfolio now positioned for higher yields
- Bay Area commercial banking is a strong franchise; loan and deposit growth demonstrate market share gains
- Trading at ~1.1x book value with ROA normalized above 1.1%
- IPO capital deployed effectively; management has credibility
Bear Case:
- Construction loan exposure creates lumpy credit outcomes
- NPA spike, even if well-collateralized, warrants monitoring
- Small-cap, limited liquidity (avg daily volume ~20K shares)
- Interest rate sensitivity if Fed cuts accelerate
Q&A Highlights
On Deposit Beta (Matthew Clark, Piper Sandler): The spot rate on interest-bearing deposits at year-end was 2.91%. Management achieved an 80% deposit beta in Q4 and targets 60% beta on non-indexed deposits with future Fed cuts. About 20% of interest-bearing deposits are indexed and will move directly with rate cuts.
On Margin Sustainability (Andrew Terrell, Stephens): The $726,000 interest reversal on the three non-accrual loans impacted the margin by 12 basis points—meaning the normalized Q4 NIM was closer to 4.25%. Management cautioned that margin could face pressure from new deposits coming in at higher rates and loan floor resets.
On Loan-to-Deposit Ratio (Timothy Coffey, Janney): Management expects the ratio to be flat or slightly down in 2026. The bank is 100% core funded, which is a strength, but don't expect the ratio to decline substantially due to competitive deposit pricing.
On Pipeline Strength (Andrew Terrell, Stephens): Q4 is historically the bank's strongest quarter while Q1 tends to be softer. However, management sees "good momentum and good pipelines throughout the bank, virtually in all divisions."
On Credit Concerns (Ross Haberman, RLH): Asked if anything else is keeping management up at night, Mordell responded: "Ross, they all keep me up at night because they can go one way or the other... But there's nothing else in credit of any trend that we're concerned about. It's kind of business as usual at this point."
On Market Opportunity (Timothy Coffey, Janney): Asked about disruption from Comerica exiting and regional bank turmoil, Mordell was measured: "I don't think it's a significant change about the disruption that happened... we always are opportunistic on people as well as clients."
Key Risks to Watch
- Construction Loan Resolution: The two downgraded construction loans totaling $19.4 million need to work out as management expects
- Bay Area Real Estate: Concentration in California, specifically the Bay Area, exposes the bank to regional economic conditions
- Interest Rate Trajectory: Further Fed cuts could pressure loan yields faster than deposit costs reprice
Looking Ahead
CEO Mordell closed the call optimistically: "We're pretty optimistic going into 2026 here. We're pleased with how we ended the year in 2025 and are gonna do our best to take advantage of our IPO, take advantage of our restructuring, and manage our balance sheet the best way we possibly can, and continue to grow at a double-digit rate."
Key items to monitor in 2026:
- NPA resolution: The $16 million Palo Alto construction loan expected to work out over 4-6 months
- Growth execution: Can management deliver on 10-15% loan and deposit growth targets?
- NIM sustainability: Headwinds from loan floor resets (~60% of $254M at floors maturing in 2026) vs. continued deposit repricing
- Sub-debt refinancing: Investment-grade rating pursuit and debt refinancing planned for 2026
- Geographic expansion: 26% of loans now outside California
- Warrant portfolio: 141 warrant positions in 95 clients as of Q4 2025